EG353 Logger Software
Use to collect performance data over a period of time. This includes temperature, output monitors and diagnostic data.
Once installed, launch the application from the ‘start
button’
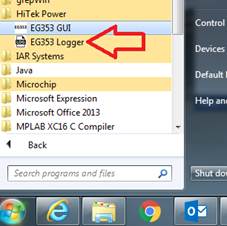
Screenshot:
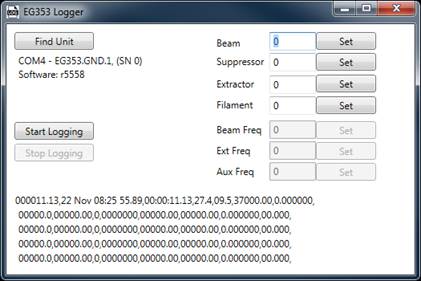
Instructions:
Application will AutoDetect the EG353 on start-up
Make sure the COM port is not in use
Set demands and wait for the output to settle
Click ‘Start Logging’ to collect data
Finish by clicking ‘Stop Logging’ button
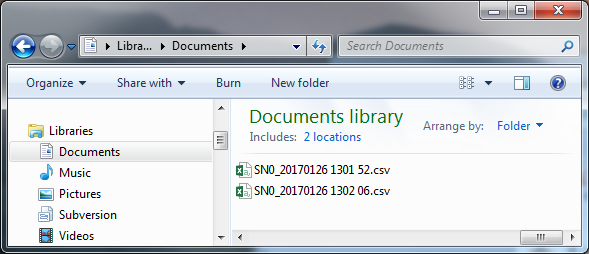
All data is written to a timestamped CSV file in the ‘Documents’ directory
under the users local profile. “C:\Users\<<username>>\Documents”
Description of CSV fields:
*_va = voltage actual
*_mv = voltage monitor
*_im = current monitor
For Engineering use only
*_fa = frequency actual
*_fm = frequency monitor (Stack PWM frequency. Beam
and Extractor only)
*_ph = Phase difference (0.0 = Stack is working at
optimal PWM frequency. Beam and Extractor only)
TIPS:
For better graph visualisation, don’t change demands while logging
Datplot is recommended for
graphing large datasets
http://www.datplot.com/
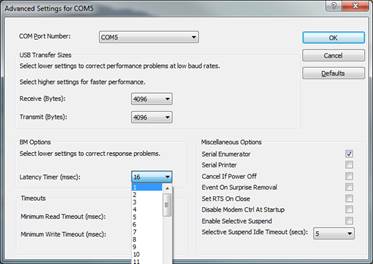
To greatly increase the poll rate, change the latency
setting to 1ms from Device Manager:
Ports (COM & LTP) -> USB Serial
Port (COM??) -> Right Click, Properties -> Port Settings -> Advanced
-> Latency Timer (msec) -> 1ms